
VISUAL EXPLAINER
The molecular framework behind an oil blend
Blending
Combines existing oils and their triacylglycerol populations.
Interesterification
Rearranges acyl groups among or within glycerides; it does not itself create trans double bonds.
Fractionation
Separates fractions through differences in crystallization and melting behavior.
R₁, R₂ and R₃ are hydrocarbon chains attached through ester bonds. This is a generic triacylglycerol structure, not a specific commercial formulation.
Source: PubChem: example triacylglycerol
Abstract
Soybean oil participates in a broad food-manufacturing economy spanning bottled oils, shortening, emulsified sauces, bakery products, snacks, prepared foods and foodservice. This report examines these applications and their implications for refining and packaging opportunities. It retains the original report's macro-to-micro structure: national supply and use, application and product mapping, revenue-based volume estimation, and a comparison of the resulting demand model with aggregate USDA data. The analysis identifies several substantial application pools while distinguishing estimated ingredient demand from verified purchasing. Source-report estimates are retained as historical working assumptions, with their limitations made explicit. The principal opportunity is to match refining, blending and packaging capability to the functional and commercial needs of individual application segments.
1. Purpose and methodology
The original April 2026 report was prepared to identify food uses of soybean oil and opportunities for refining and packaging capacity. Its English and Chinese versions represent the same study. This publication preserves that commercial purpose and the report's application coverage, while improving presentation and identifying claims that need further verification.
The source analysis combined USDA supply-and-use information, FoodData Central ingredient records, company financial disclosures and industry reports. Its bottom-up model converted revenue into implied finished-product volume and then estimated the soybean-oil fraction. That method is useful for organizing an initial opportunity screen, but the underlying price, geographic allocation and formulation assumptions are not equivalent to measured ingredient purchases.
No new survey or experiment is reported. Figures labeled “source-report estimate” below reproduce the original working analysis; they are not independently validated market statistics. Brand names identify examples discussed in the source, not audited current formulations, ownership relationships or supplier rankings.
2. U.S. supply, demand and the food–fuel balance
The original analysis situates food opportunities within a soybean-oil market shared with fuel and other uses. USDA's Oil Crops Yearbook provides official supply, disappearance, trade and price series.[1] Marketing years, release dates and the distinction between estimates and forecasts must remain visible when comparing those data.
| Measure | Source value | Interpretation |
|---|---|---|
| U.S. soybean-oil production, 2021/22 | 26.1 billion lb | Historical figure cited in the draft; not a current-year production figure. |
| U.S. domestic soybean-oil disappearance, 2023/24 | 27.2 billion lb | Aggregate domestic use, not food-only demand. |
| 2025/26 production projection | 30.33 billion lb | Forecast reproduced from the source report; the exact USDA release vintage was not supplied. |
| 2025/26 food, feed and other industrial use | 15.35 billion lb | A combined category; cannot be presented as human food consumption. |
| 2025/26 biofuel use projection | 14.0 billion lb | Source-report forecast, not a final annual result. |
Source: supplied April 2026 soybean-oil report. Values are retained for continuity with its analysis, not represented as independently verified or updated forecasts. Use the relevant USDA release before making a purchasing or capacity decision.
The source report's central commercial observation is that food demand must be evaluated alongside fuel demand. Its quoted allocation would put biofuel use close to the combined food, feed and other industrial category. This is an implication of the draft's assumptions, not evidence that food demand itself has fallen.
USDA defines food, feed and other industrial use as domestic disappearance less biofuel use.[2] This distinction matters when interpreting the draft's proposed food-use segmentation: salad and cooking oils at approximately 45–50%, baking and frying fats at 30–35%, margarine and spreads at 5–8%, and other edible uses at 10–15%. Those are source-report ranges with an unverified denominator, not a measured partition. They should not be added into a pie chart or treated as shares known to total 100%.
3. Applications, product landscape and formulation roles
The source report identifies thirteen application groups. Liquid oil, a structured fat blend and a high-oleic grade are distinct commercial products; their suitability depends on the function required in the finished food. The following table retains the full application map and representative examples without implying a current brand-level formulation audit.
| Application | Role and original product examples | Commercial implication |
|---|---|---|
| 1. Retail bottled vegetable oil | Liquid cooking oil; examples include Crisco, Wesson and private-label oils. | Refining consistency, retail pack formats and private-label service. |
| 2. Shortening | Structured baking and frying fats; Crisco and industrial shortening grades were discussed. | Requires application-specific blending and finishing capability beyond liquid-oil packing. |
| 3. Mayonnaise | A major oil phase in emulsified products; Hellmann's, Kraft and Duke's were examples. | A concentrated application pool for consistent flavor and emulsion performance. |
| 4. Salad dressings | Creamy and pourable dressings; Hidden Valley, Kraft, Wish-Bone and Ken's were examples. | Oil blends may vary; product-level rather than brand-wide demand assessment is needed. |
| 5. Margarine and buttery spreads | Liquid-oil component within a structured emulsion; Country Crock, Parkay and other spreads were discussed. | Opportunity depends on the complete fat system and cold-processing capability. |
| 6. Salty snacks | Frying or added oil in chips and related snacks; Doritos and Tostitos were among the source examples. | Alternative-oil declarations prevent a reliable soybean share from being inferred from the category alone. |
| 7. Cookies and sweet baked goods | Fat in dough, cake and filling systems; Oreo, Chips Ahoy! and snack cakes were examples. | Liquid-oil demand may coexist with palm or other structuring fats. |
| 8. Crackers | Dough and surface-oil applications; Ritz, Triscuit, Wheat Thins and Goldfish were discussed. | Flavor, texture and shelf life differ between applications and grades. |
| 9. Bread and buns | Relatively low inclusion in high-volume products; Sara Lee, Nature's Own and Wonder were examples. | Small recipe percentages can still matter commercially at production scale. |
| 10. Frozen meals and pizza | Oil may occur in dough, sauce and prepared components; Stouffer's, DiGiorno and Totino's were examples. | Component-level analysis avoids counting total food fat as soybean oil. |
| 11. Non-dairy creamers | Emulsified or powdered fat systems; Coffee-mate and International Delight were discussed. | Liquid and powder formats require separate formulation and process assessment. |
| 12. Quick-service and foodservice frying | Bulk frying oils and blends for chains and independent kitchens. | Evaluate actual account purchases, oil turnover, food quality and supply arrangements. |
| 13. Liquid butter alternatives | Flavored oils for griddling, pan-frying and basting; Phase and Whirl were examples. | Connects soybean-oil supply to flavor systems and foodservice packaging. |
Formulation assumptions in the original model. The draft used broad soybean-oil inclusion ranges such as 65–80% for mayonnaise, 40–65% for creamy dressings, 4–10% for cookies, 8–15% for crackers, 1–3% for bread and 3–6% for frozen pizza. These are unverified screening assumptions, not specifications for the examples named above. Recipes, alternative-oil clauses and other fat ingredients can substantially change the soybean fraction.
FoodData Central's branded-food records are based on manufacturer label information.[5] Such records support ingredient screening but do not establish confidential recipe percentages or annual purchasing. Legacy entries in the source that list partially hydrogenated oils should not be treated as verified current U.S. formulations.
For frying, high-oleic soybean oil is a separate performance proposition. Selected experimental work found improved stability for the tested high-oleic oil while identifying flavor trade-offs.[3] For shortening, published work shows that interesterification of soybean oil and fully hydrogenated soybean oil changes physical properties.[4] Both observations reinforce the original report's distinction between selling a commodity oil and supplying a functional fat system.
4. Revenue-based volume estimates
The original method starts with disclosed or estimated revenue, converts it into implied product mass using an assumed wholesale price, and applies an estimated soybean-oil fraction. Where only global or segment revenue is available, additional geographic and category allocations are needed.
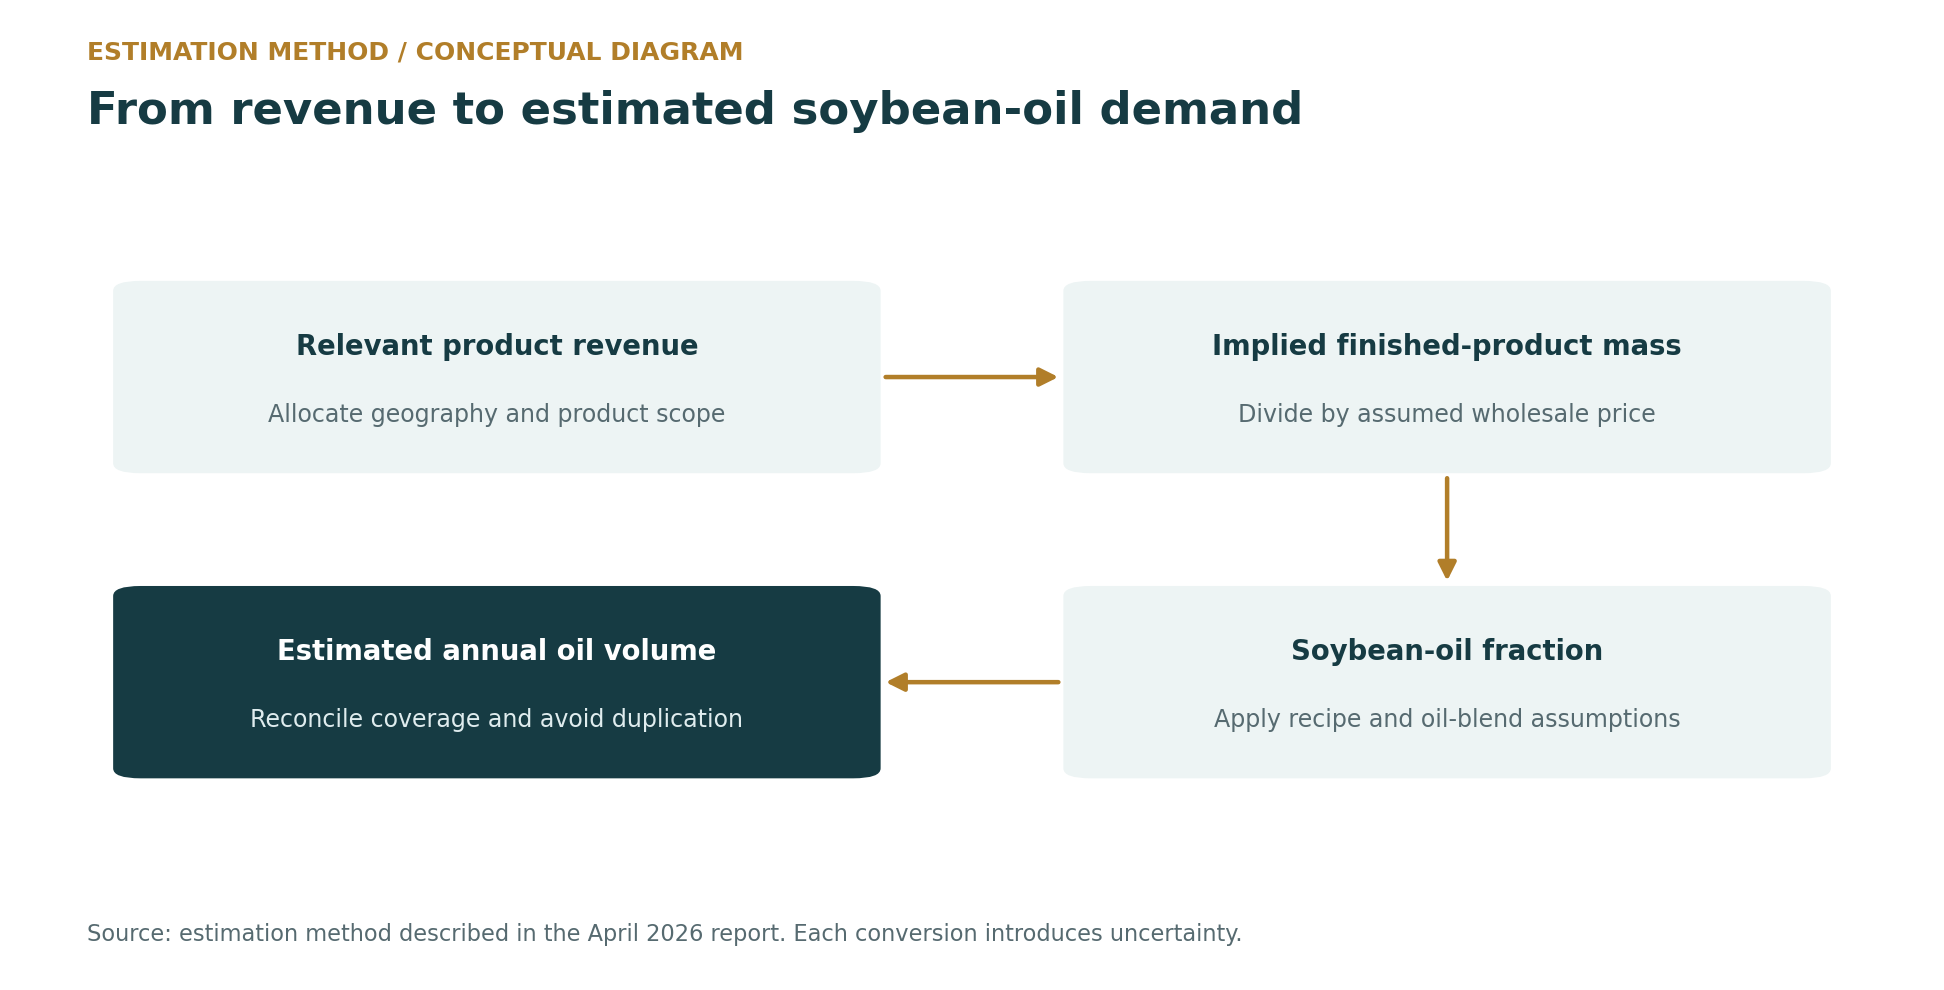
Published revenue, estimated brand revenue and total segment revenue are different evidence types. A parent company's revenue cannot be treated as a single product's sales. Likewise, ingredient order and total fat do not provide an exact soybean-oil mass fraction. The draft's suggested ±25–40% uncertainty is a judgmental range, not a statistically derived confidence interval.
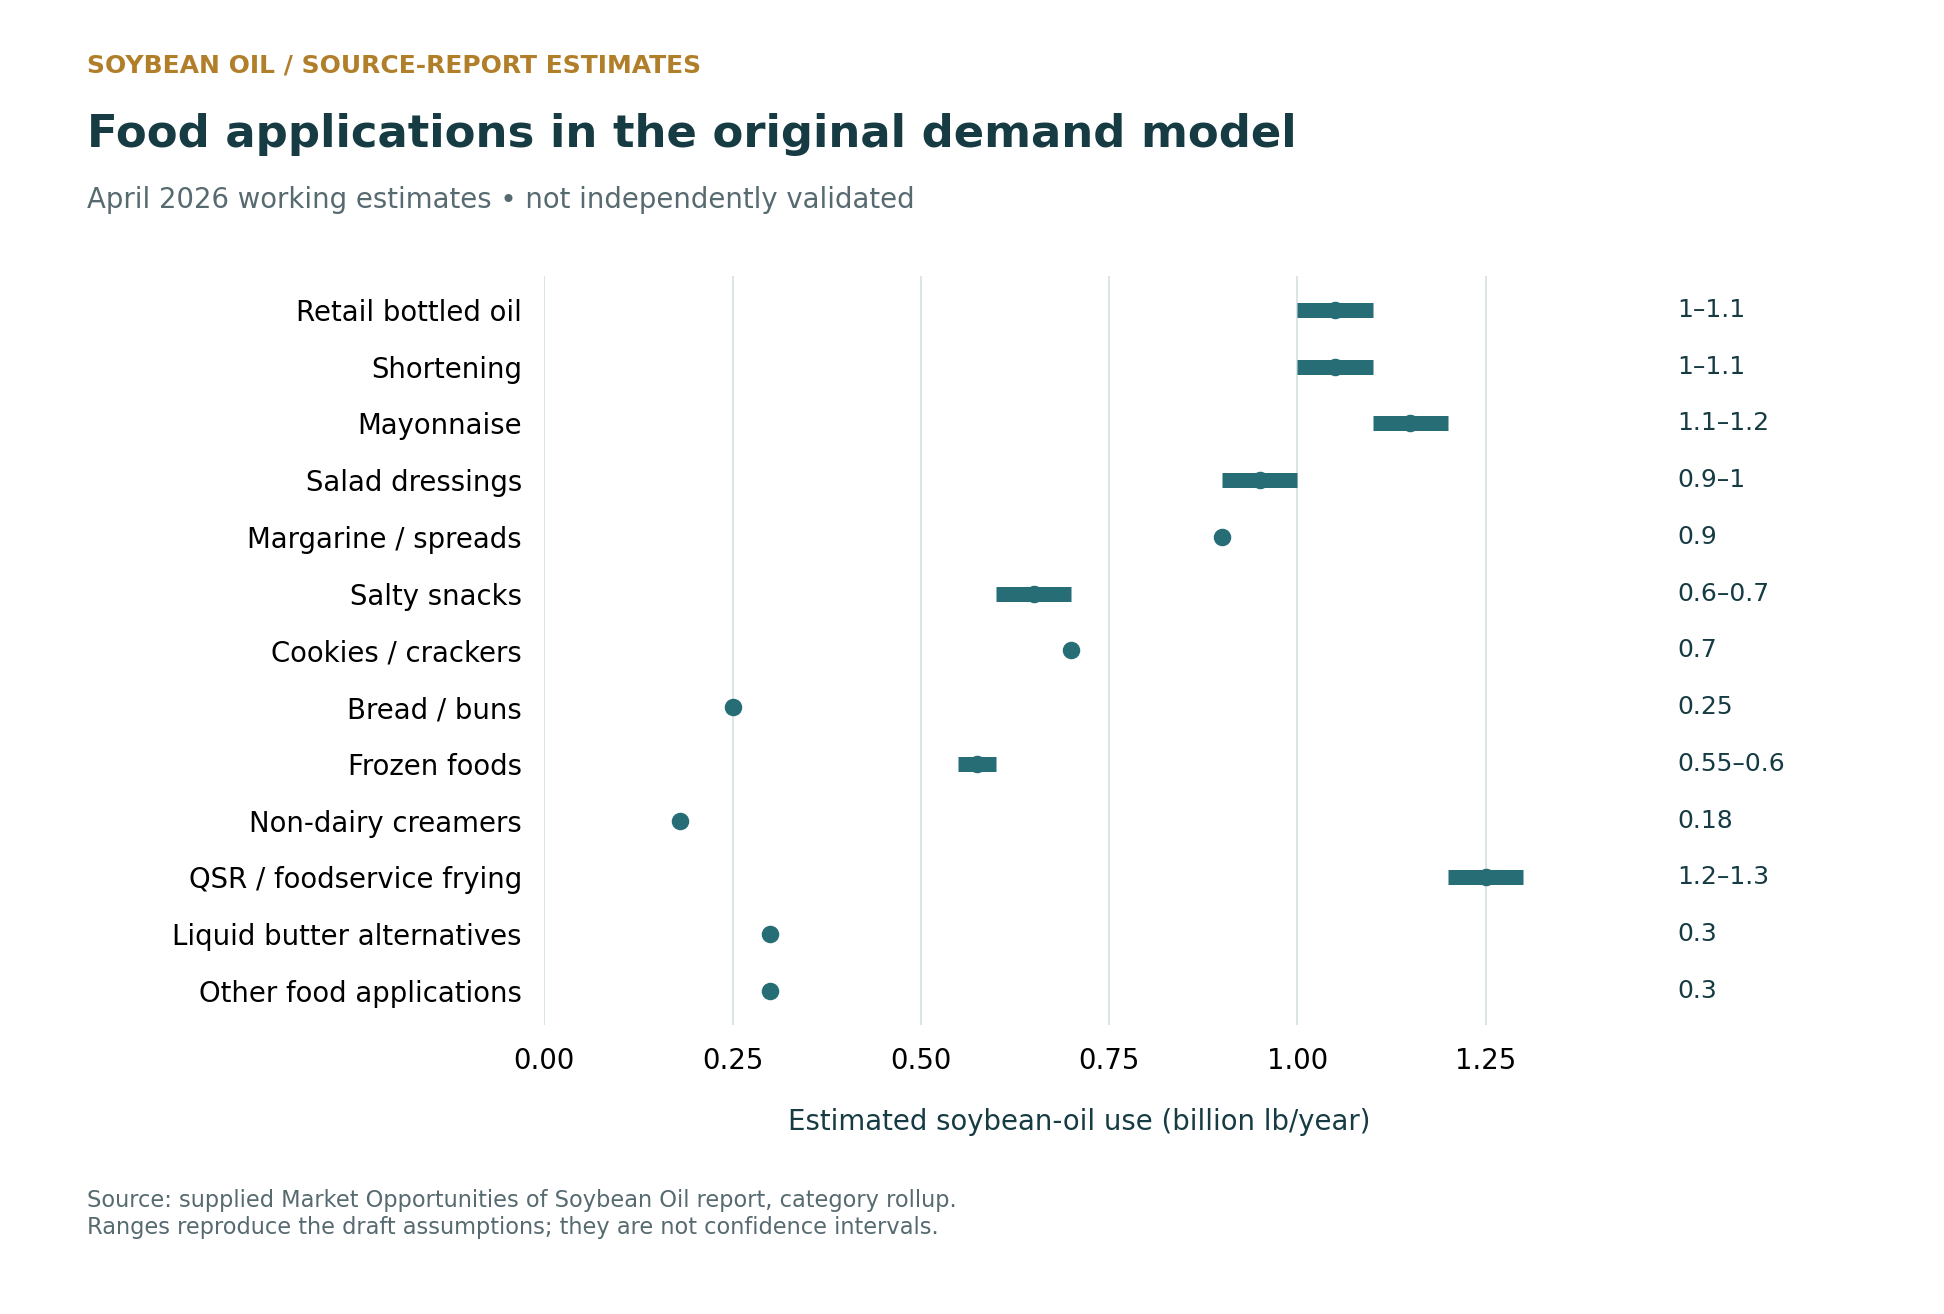
| Application group | Source estimate |
|---|---|
| Retail bottled oil | 1.0–1.1 |
| Industrial and retail shortening | 1.0–1.1 |
| Mayonnaise | 1.1–1.2 |
| Salad dressings | 0.9–1.0 |
| Margarine and spreads | 0.9 |
| Salty snacks | 0.6–0.7 |
| Cookies and crackers combined | 0.7 |
| Bread and buns | 0.25 |
| Frozen foods | 0.55–0.6 |
| Non-dairy creamers | 0.18 |
| QSR and foodservice frying | 1.2–1.3 |
| Liquid butter alternatives | 0.3 |
| Confectionery, infant formula and other uses | 0.3 |
The source states a combined estimate of 8.9–9.6 billion lb/year. Adding the displayed category endpoints gives 8.98–9.63 billion lb/year, close to that approximate range. The extra decimal places reflect arithmetic, not measurement precision. Neither range is an independently established food-consumption total. Company-level estimates also require a separate audit before being used as sales targets.
5. Reconciliation with USDA and commercial implications
The source compares its bottom-up estimate with approximately 15 billion lb in the broader food, feed and other industrial category. That comparison can identify a gap, but it cannot prove that the residual is entirely feed or non-food industry. Incomplete account coverage, mixed periods, oil-share assumptions and double counting may also contribute. Exports and ending stocks should not be inserted into the domestic-use residual merely to close it.[2]
The draft identifies large recurring application pools in bottled oil, shortening, mayonnaise, dressings and foodservice frying. Within its estimates, liquid butter alternatives provide a smaller adjacent category, while bread illustrates how low inclusion can combine with high food-production volume. These relationships help organize customer prospecting even while the absolute quantities remain provisional.
For refining and packaging, the opportunity is broader than retail bottles. The application map supports investigating bulk supply to sauce and bakery manufacturers, industrial and foodservice pack formats, private-label filling, and appropriately qualified functional blends. Refined-oil consistency, flavor, oxidation control and dependable supply remain relevant across segments, while structured fats and emulsified products introduce additional manufacturing requirements.
Capacity utilization should therefore be assessed against the mix of addressable customers and product grades, not only a national consumption estimate. The original report's U.S. application landscape offers a prospecting reference for a refining and packing operation; translating it into demand in China or another region requires local customer, formulation, trade and logistics evidence.
6. Company disclosures and evidence quality
The source report drew on public annual reports and filings from companies including PepsiCo, Unilever, Mondelez, Nestlé, J.M. Smucker, Flora Food Group, Flowers Foods and Grupo Bimbo, together with supplier and trade publications. Those materials serve different purposes: company revenue may indicate business scale, whereas product labels describe a particular food and supplier statements may describe ingredient capability. None independently supplies a complete purchasing ledger for soybean oil.
The publication consequently retains the application landscape and category model but does not present the draft's brand ownership lists, market-share rankings or calculated company oil purchases as verified current facts. Private-label production and upstream foodservice supply can overlap with downstream branded accounts, making duplication a particular concern. Soy lecithin is another relevant soybean-derived ingredient stream, but it should be evaluated separately from the refined-oil volumes in this model.
7. Limitations and conclusion
The study is an opportunity screen assembled from public information. Its principal limitations are undisclosed formulations, changing alternative-oil blends, inconsistent revenue coverage, uncertain wholesale prices, private-company data gaps and possible overlap between suppliers and customers. Its quantitative estimates are retained for transparency, not validated by publication. The source reports do not supply a reproducible dataset sufficient to resolve every company-level calculation.
Soybean oil remains the subject of a diverse food-application opportunity map in this analysis. Liquid oils, sauces, bakery products and foodservice represent distinct routes to refining and packaging demand. The report's contribution is the connection between those applications and potential commercial channels; the next evidence requirement is to replace inferred demand with product-specific and customer-specific information.
References
- USDA Economic Research Service. Oil Crops Yearbook and documentation. Official supply-and-use data resource.
- USDA Economic Research Service. U.S. Bioenergy Statistics: Documentation. Definitions and derivation of soybean-oil use categories.
- Warner, K., & Gupta, M. (2005). Potato chip quality and frying oil stability of high oleic acid soybean oil. Journal of Food Science, 70(6), 395–400. USDA ARS record and technical abstract.
- Zero trans fats from soybean oil and fully hydrogenated soybean oil: Physico-chemical properties and food applications. Food Research International (2009). Experimental study; accessible abstract.
- USDA Agricultural Research Service. FoodData Central: Data Type Documentation. Definitions and provenance of food-composition and branded-food records.